A quick look at Rookout, a real-time debugging & logging product
![]()
The great thing about defining a new category is that there is no competition. The bad part is it can be difficult to explain what problem your product solves and how it fits alongside other tools. Rookout, described as “Rapid Debugging. Frictionless Logging” falls into this bucket. Recently I spent a couple hours digging into Rookout to better understand its place in an engineering team’s tool chest.
If you ask me to define a debugger, I go straight to an interactive debugger. For example, searching for Rails debugger brings up pry and byebug. These are both interactive debuggers where the application pauses at breakpoints and allows you to step through the execution (even running arbitrary code). This is not what Rookout does. Rookout does not pause a live application. I think a better description is that Rookout lets developers apply temporary logging to a live application without having to deploy a new version. Let me explain.
Let’s say your exception monitoring service (say Sentry) is reporting an elevated error rate and your APM product (say ScoutAPM) is showing a rapid increase in response times. You inspect the exception details and transaction traces but do not see an obvious culprit. Next step? Adding some additional log lines.
If you aren’t using Rookout, you typically do this by creating a new git branch, adding the new log lines, and deploying. This deployment cycle can be lengthy on large, critical applications. Additionally, it’s rare to capture what you need in the first commit+deploy cycle. This means more deploys, more logging, and a slow feedback cycle. Instead, what if could tell your live, production app in real-time to begin logging additional information at a given file and line number? That’s what Rookout can do.
I took Rookout for a spin using their demo Python Django application. After following their setup instructions (and with some fast help from their support team) here’s how it works:
-
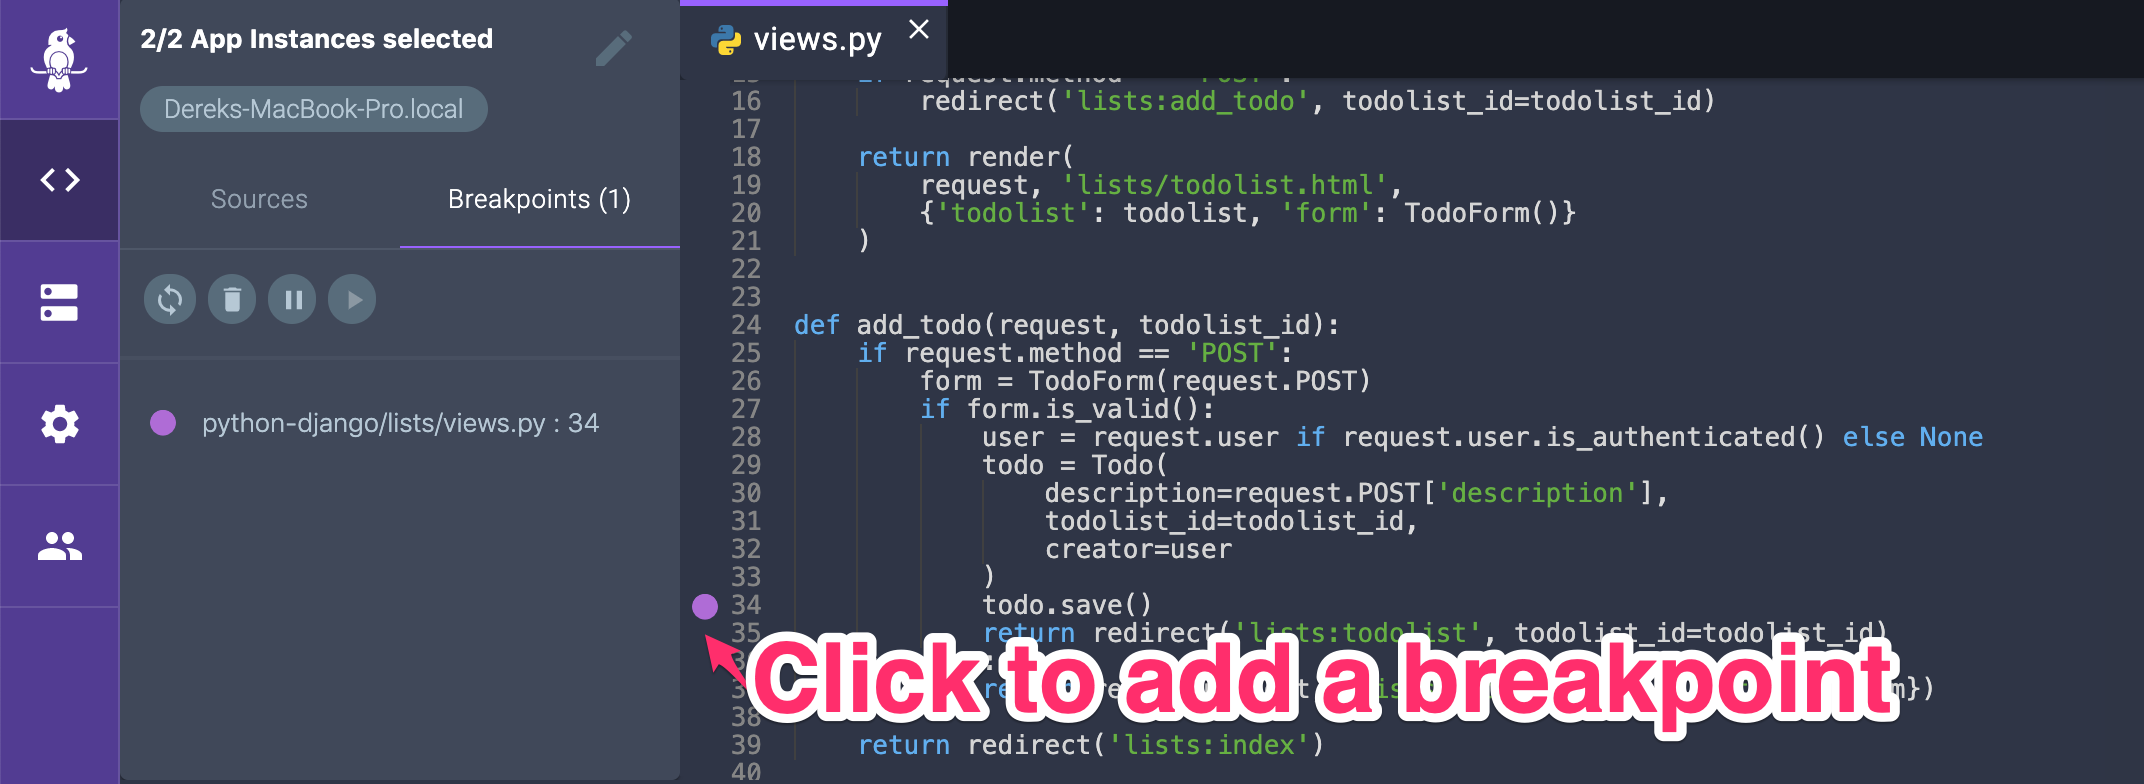
Open the “sources” tab. Navigate to the file and line number you wish to add a breakpoint.
-
Click in the gutter next to the line number.
-
Wait a couple seconds for the confirmation that the breakpoint is active.
When the breakpoint is triggered, a new message will appear in the Rookout UI:
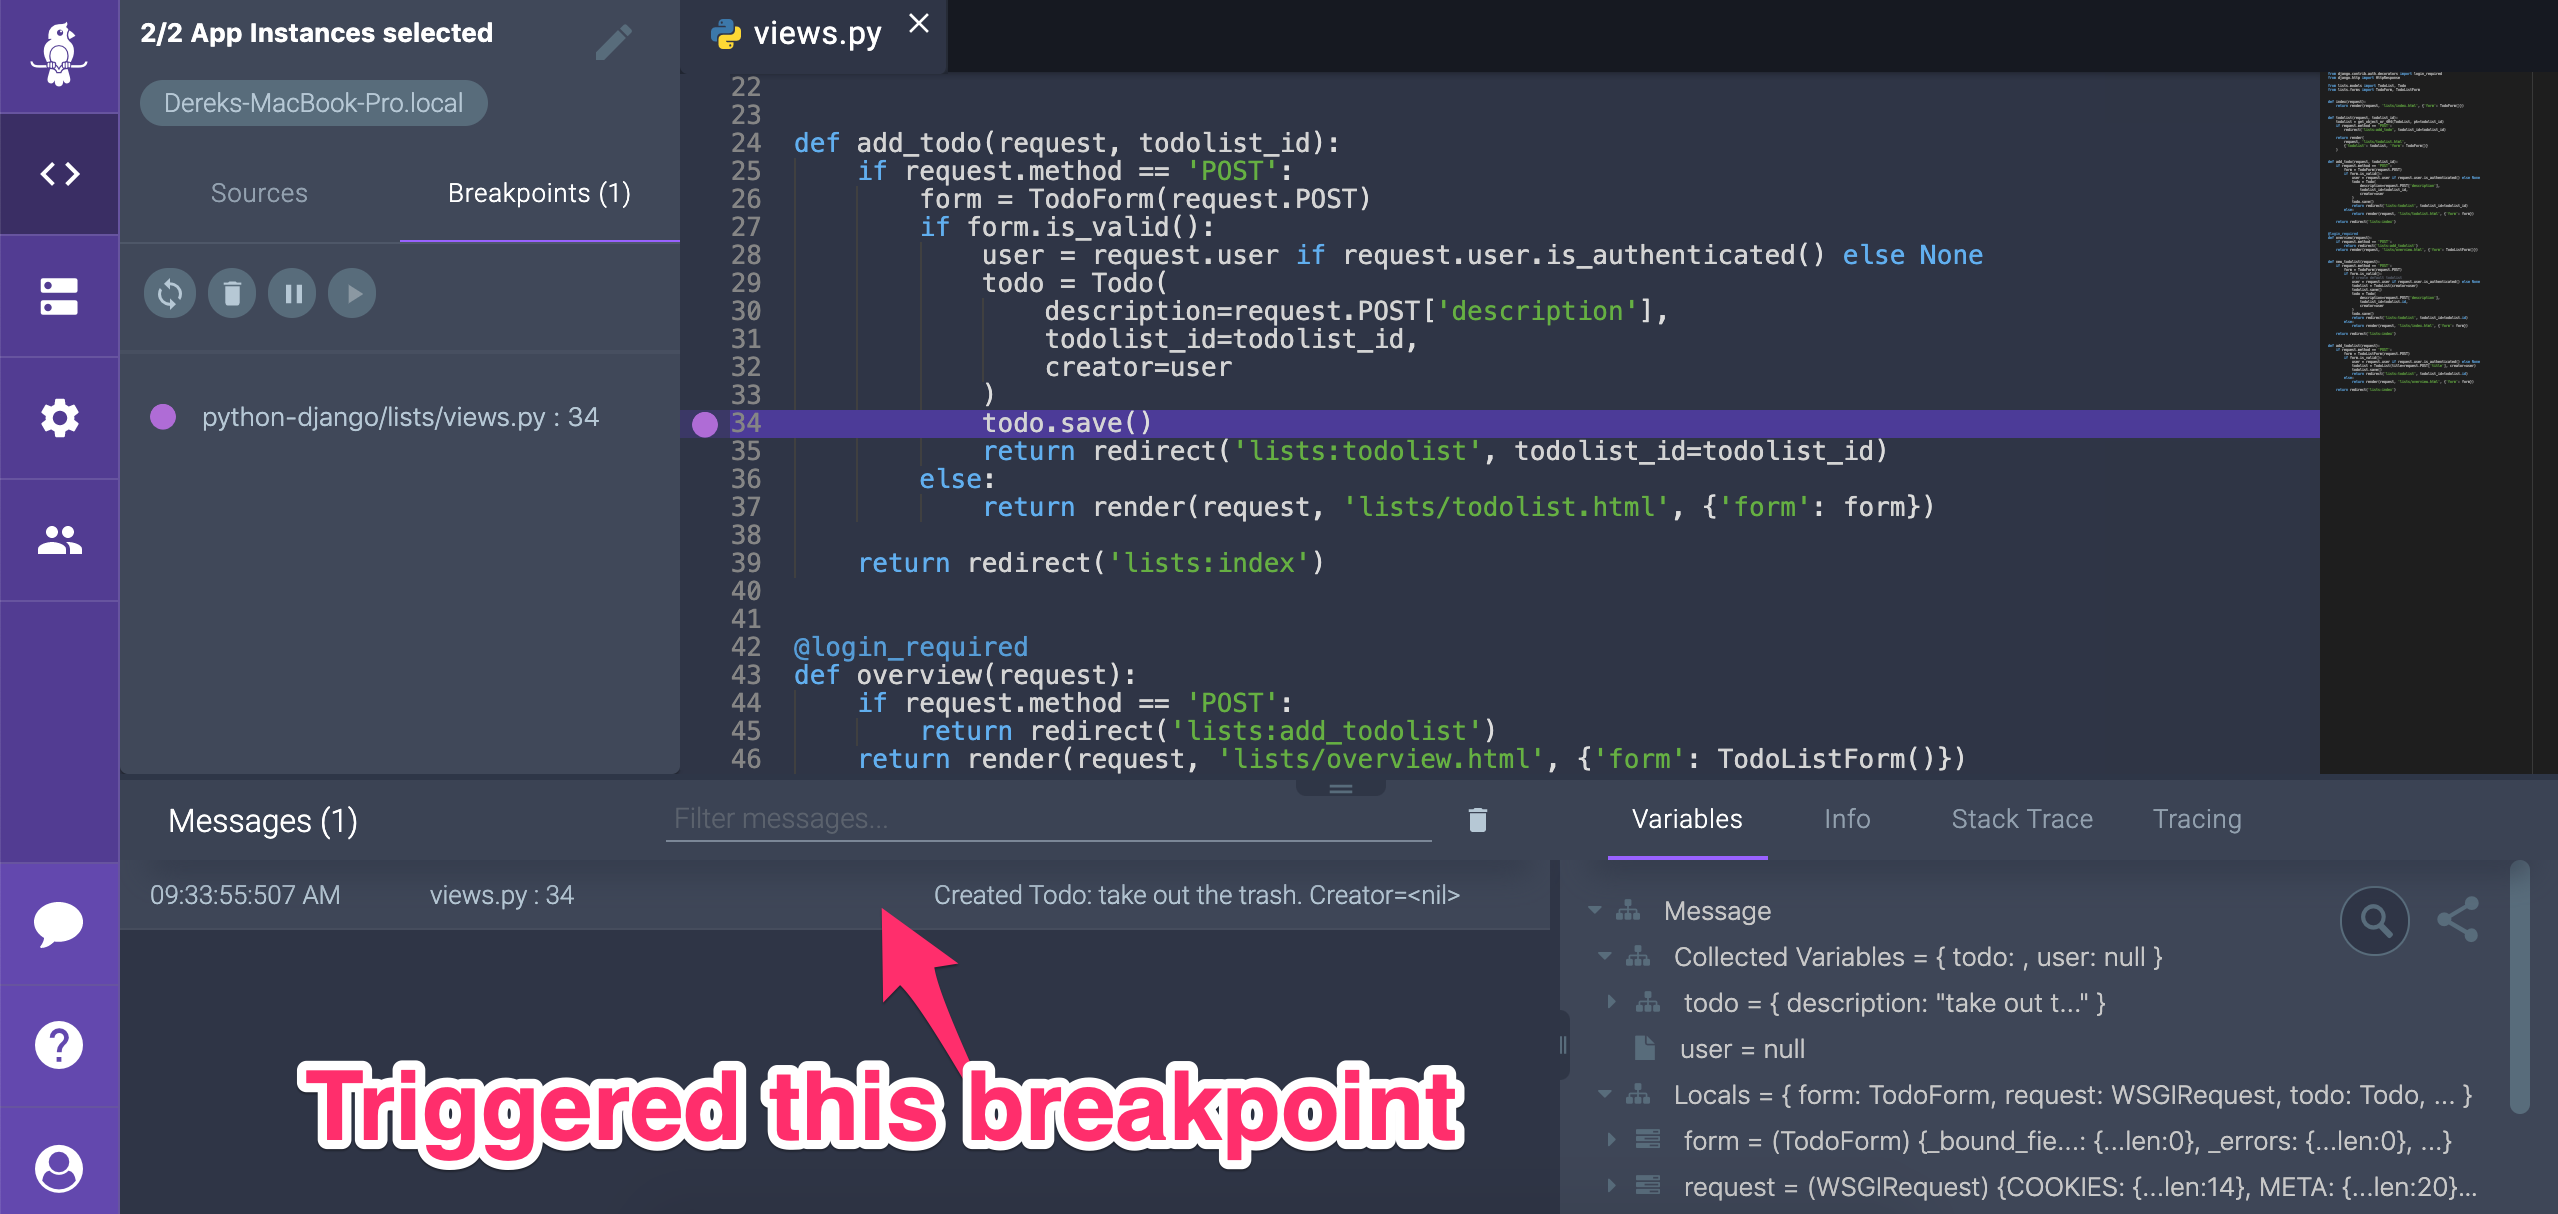
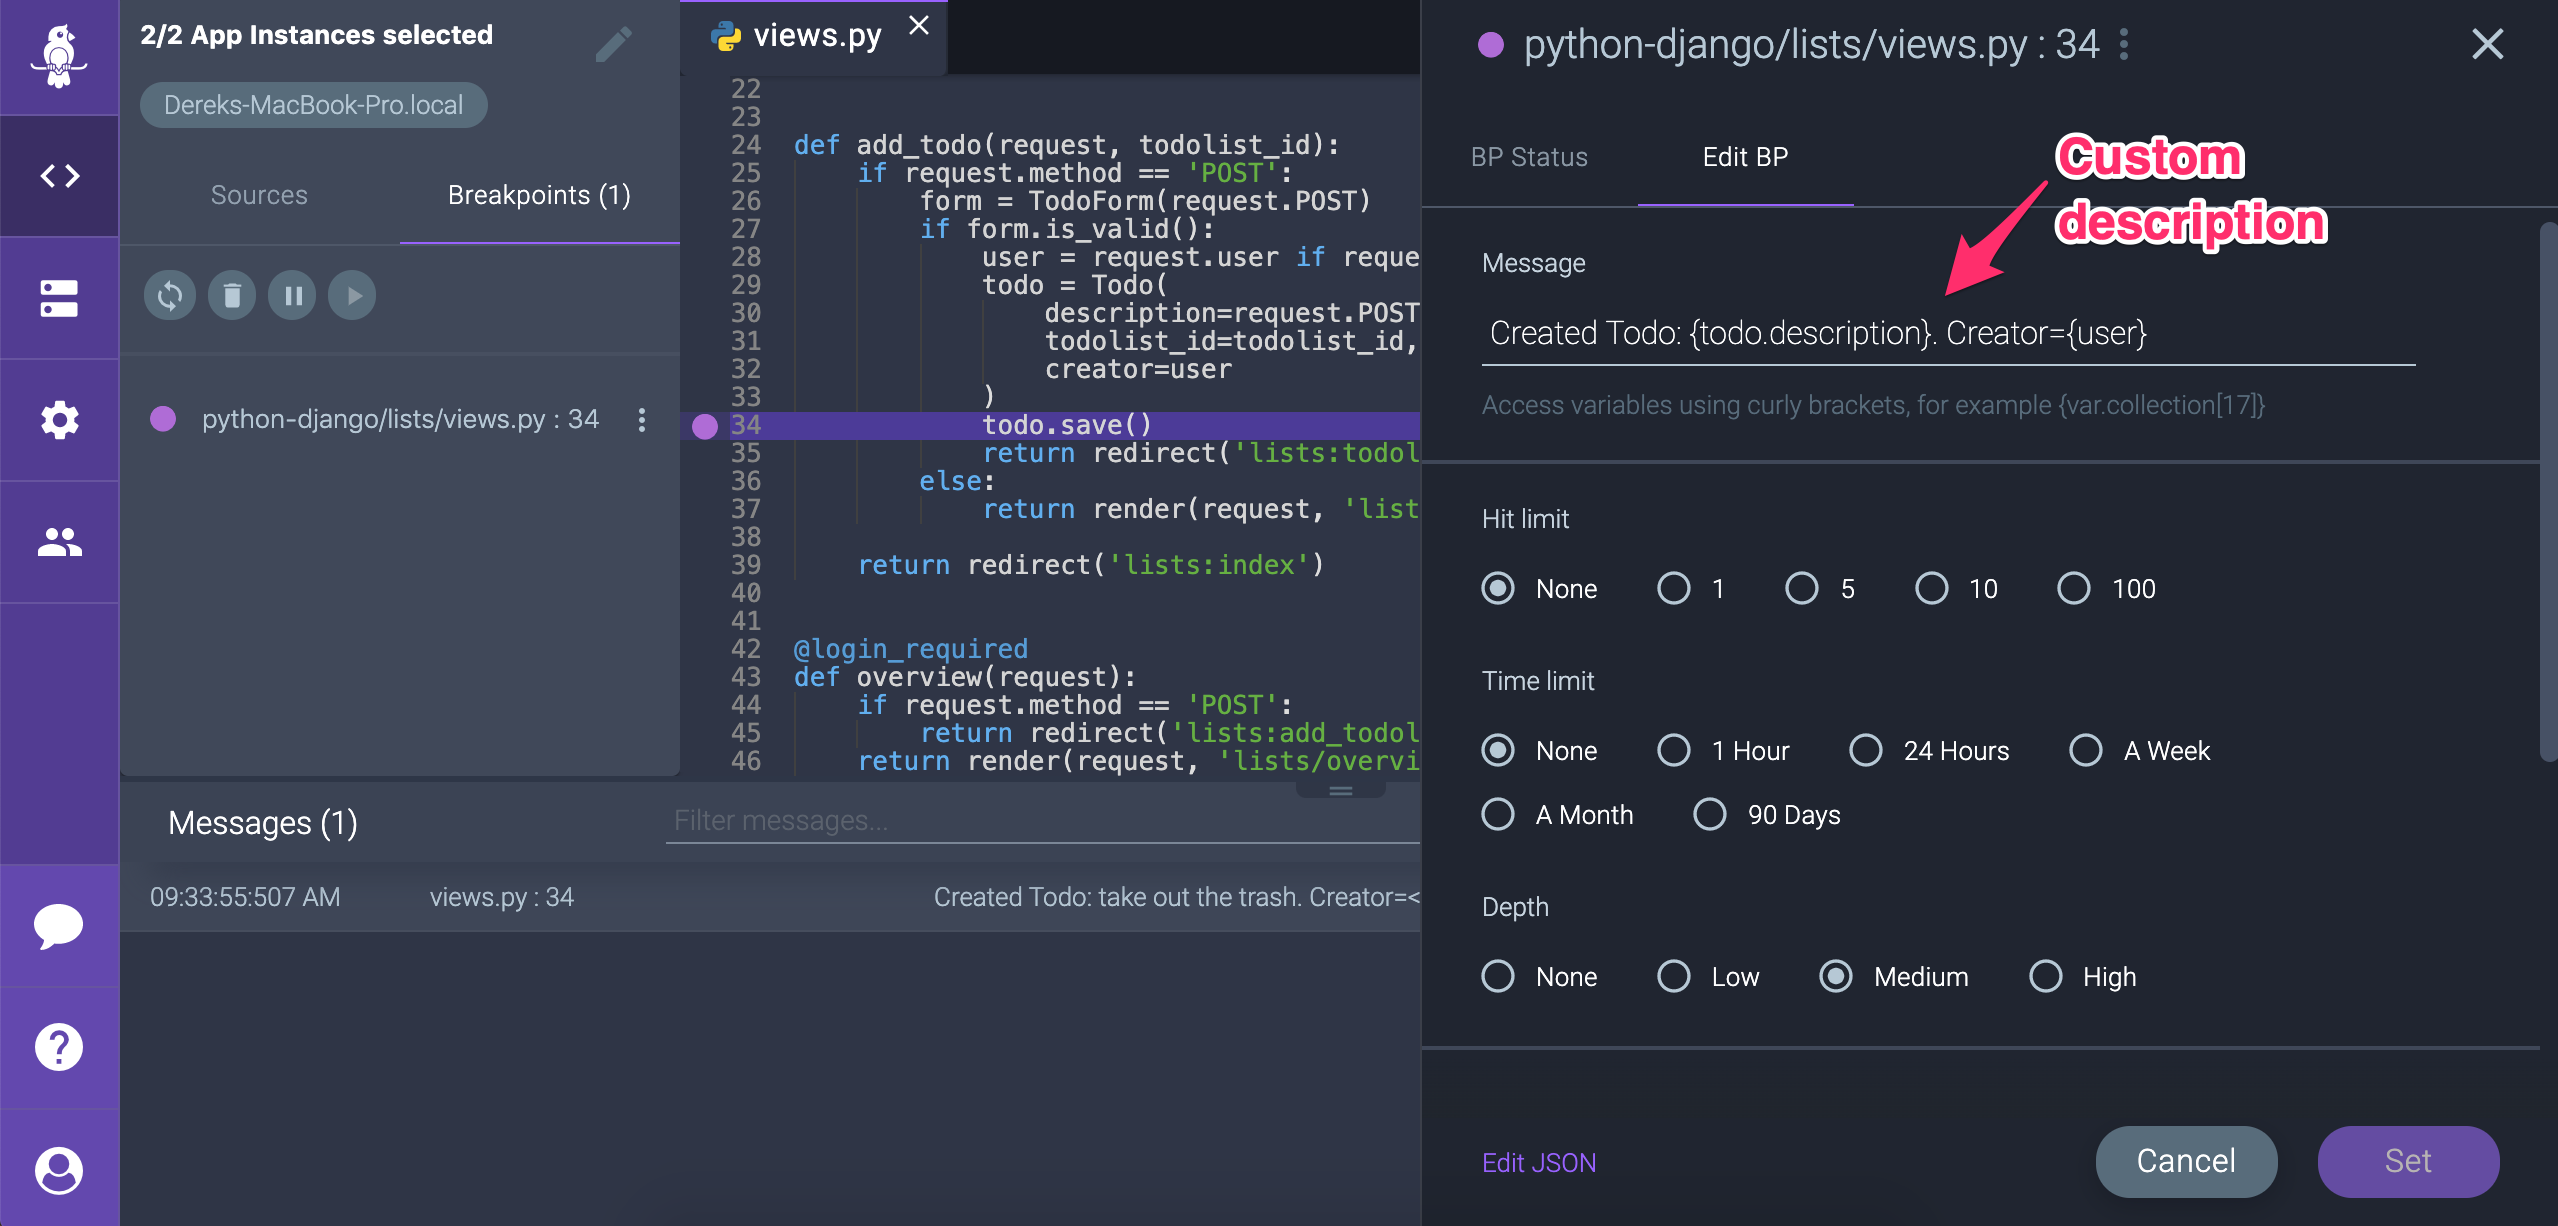
Click the message row for more details (like the local variables, stacktrace, and more). You can also define a custom log message and reference variables and their properties. For example, I modified the log message to print the todo description:
It’s likely you are using another destination for your logging output. From Slack to ElasticSearch to DataDog, Rookout can send messages to many targets.
A significant fuzzy area for me is how likely a breakpoint will persist across git commits and branches. What if you modify a file that contains existing breakpoints - do the breakpoints disappear on the next commit? Rookout support says they make a best-effort to preserve breakpoints by hashing each LOC referenced by a breakpoint, but that it isn’t always possible. Because of that, it seems safer to view Rookout as a temporary logger when actively debugging a problem. As a product, they would be in a better position if breakpoints were guaranteed to persist. Then, you could depend on Rookout to log everything. I can see this being a hard problem to solve.
In summary, Rookout is an interesting way to increase logging in a production app without requiring new deploys to add calls to a logger. I think it’s most valuable for teams that have larger apps where the deploy cycle is longer.
Disclaimer: I have not tested Rookout on a live, significant, production application.